In this review, we explore two of the most used designs for droplet generation: T-junction and flow focusing. First, we discuss how it is possible to predict droplet size in microfluidics. Then, we introduce the results we have obtained for two chips with two common fluorinated oils, based on the use of a controller pressure system and microfluidic devices offered at Darwin microfluidics.
Material
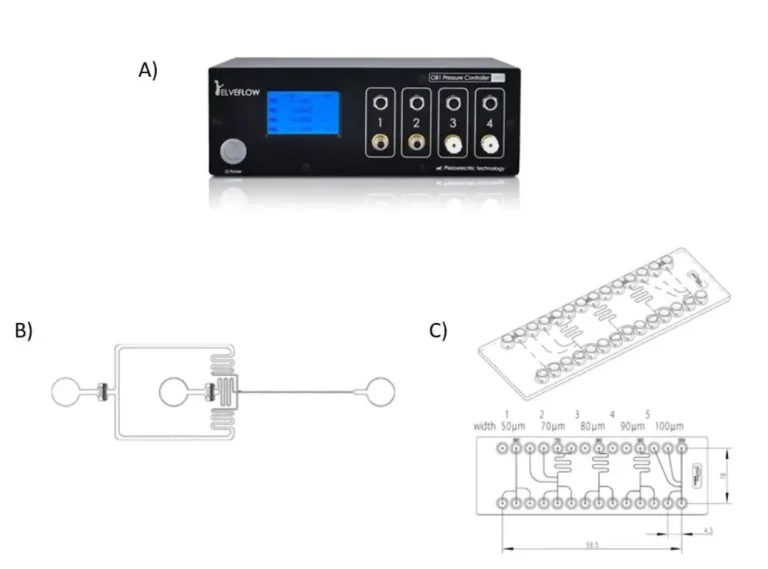
To perform our characterisation, we chose to use a pressure controller and two types of chips: a PDMS chip with a flow focusing geometry and a polycarbonate chip integrating different T-junctions designs (see figure 1).

These experiments allowed us to evaluate the size of the droplets according to the different geometries of the droplet generating systems, but also according to the type of oil used (FluoDrop 40 and FluoDrop 7500 (with 2% of FluoSurf) which are the most commonly used fluorinated oils in microfluidics).
How to predict your droplet size?
The required step in all droplet-based devices is droplet formation. A droplet generator must deliver an application-specific performance that includes a prescribed droplet size and generation frequency while producing monodisperse droplets. The desired performance is usually reached through several cost- and time-inefficient design iterations.
To facilitate this stage of droplet generation, several studies have been carried out to predict the size of the droplets according to the geometry of the droplet generator and the viscosity of the continuous phase used.
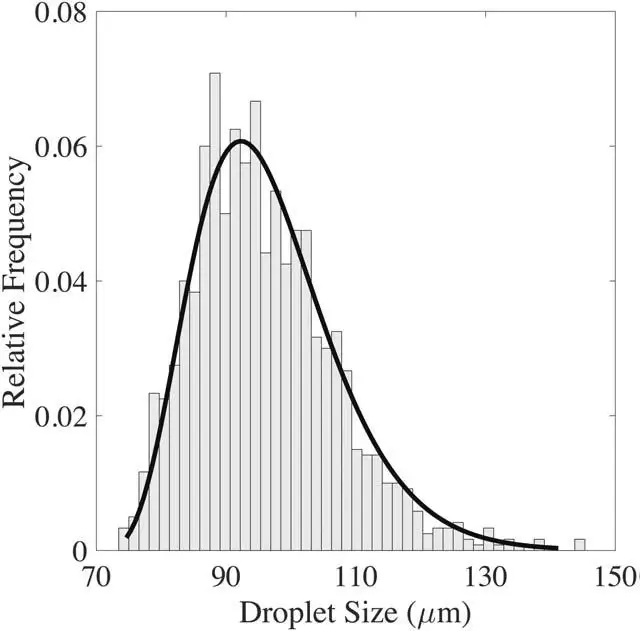
For example, Prileszky and coworkers demonstrate that the size of droplets produced in a T-junction is gamma-distributed (see figure 2), providing additional insight into the physics of the breakup process and the properties of emulsions generated in microfluidics. They show that the size of the droplets produced in a T-junction is distributed by gamma radiation, which allows a better understanding of the physics of the rupture process and the properties of the emulsions generated in microfluidics. Knowledge of the underlying probability distribution allows the control of droplet size for droplets made from viscous materials. Understanding how dispersed phase viscosity affects droplet size is essential to create droplets with the correct geometry and properties [Prileszky et al. 2016 AIChE Journal].

The gamma distribution seems to be the best-fitting model, even outperforming the more commonly used log-normal distribution, demonstrated by the large disparity between the Anderson-Darling statistics (this test measures the distance between a hypothesized distribution and the empirical model over the entire cumulative distribution function (cdf) of the hypothesized distribution) and associated p-values from representative probability plots.
The development of a probabilistic description of a physical process leads to the correlation of the measurements with the physical parameters. Without understanding the shape of the distribution of a random variable, systematic noise in experimental data directly translates into systematic errors in a proposed correlation. However, filtering out the noise by comparing an experimental distribution to a theoretical distribution makes it possible to better estimate the mean of the real distribution, by minimising the propagation of the error through regression analyses. Consequently, identifying the gamma distribution as representative of the variability in the size of droplets formed in a T-junction allows a more accurate correlation of droplet size with viscosity and flow rate of the dispersed phase [Prileszky et al. 2016 AIChE Journal].
Another technique for predicting drop size is numerical simulation via the COMSOL software. In this example, the process of droplet formation in a microfluidic flow-focusing device is investigated. Several findings were made: It was shown that the accuracy of the numerical solution increases with the water flow rate. Indeed, the average error decreased from 14.6 to 6.96 % by increasing the water flow rate from 0.3 to 0.6 μL/min. Then, the variation of the droplet radius as a function of the flow ratio and the number of capillaries was studied. It was shown that these two parameters were the main parameters affecting droplet size, rather than water and oil flow. Finally, it was shown that capillary number is more dominant in determining the droplet radius in comparison to flow ratio [Lashkaripour et al. 2015 JAMECH].
Characterization of the droplet size for two standard chips (flow focusing and T-junction)
To carry out this characterization, we have decided to evaluate the size of the droplets generated by flow focusing and T-junction with 2 fluorinated oils widely used in microfluidics. In the following table, you can find the results obtained.
| Droplet generator geometry | Droplet size (µm) with FluoDrop 40* oil | Droplet size (µm) with FluoDrop 7500* oil |
| Flow focusing (DG-DM1-45) | 20 → 79 | 21 → 93 |
| T-junction (CS-10000176) design 1 | 98 → 312 | 60 → 494 |
| T-junction (CS-10000176) design 2 | 18 → 70,002 | 12 → 70 |
| T-junction (CS-10000176) design 3 | 11 → 79 | 22 → 78 |
| T-junction (CS-10000176) design 4 | 94 → 484 | 96 → 387 |
| T-junction (CS-10000176) design 5 | 270 → 876 | 345 → 700 |
*The viscosity of HFE is 0.77 cSt and the viscosity of FC40 is 2.2 cSt
According to Nekouei and Vanapalli’s publication (2017), the interpretation of these results shows that the higher the viscosity of the continuous phase, the smaller the size of the droplets generated.
